While performing clustering, it is not uncommon to try a few different clustering methods. In such situations, we want to find out how similar are the results produced by different clustering methods. In some other situations, we may be interested in developing a new clustering algorithm or might be interested in evaluating a particular algorithm for our use. To do so, we make use of data sets with known ground truth so that we can compare the results against the ground truth. One way to evaluate the clustering results in all these situations is to make use of a numerical measure known as Rand index (RI). It is a measure of how similar two clustering results or groupings are.
Rand Index (RI)
RI works by looking at all possible unordered pairs of examples. If the number of examples or data vectors for clustering is n, then there are $\binom{n}{2}(=n(n-1)/2)$ pairs. For every example pair, there are three possibilities in terms of grouping. The first possibility is that the paired examples are always placed in the same group as a result of clustering. Lets count how often this happens over all pairs and represent that count by a. The second possibility is that the paired examples are never grouped together. Let's use b to represent the count of all pairs that are never grouped together. The third possibility is that the paired examples are sometimes grouped and sometimes not grouped together. The first two possibilities are treated as paired examples in agreement while the third possibility represents pairs in confusion. The RI of two groupings is then calculated by the following formula:
$\text{RI} = \frac{\text{Count of Pairs in Agreement}}{\text{Total Number of Pairs}} = \frac{(a+b)}{\binom{n}{2}}$
We can notice from the formula that RI can never exceed 1 and its possible lowest value is 0.
Let's take an example to illustrate RI calculation. Say we have five examples clustered into two clusters using two different clustering methods. The first method groups examples A, B, and C into one group and examples D and E into another group. The second clustering method groups A and B together and C, D, and E together. To compute RI for this example, lets first list all possible unordered pairs of five examples at hand. We have 10 (n*(n-1)/2) such pairs. These are: {A, B}, {A, C}, {A, D}, {A, E}, {B, C}, {B, D}, {B, E}, {C, D}, {C, E}, and {D, E}. Examining these pairs, we notice that the pair {A, B} and {D, E} are always grouped together by the both clustering methods. Thus, the value of a is two. We also notice that four pairs, {A, D}, {A, E}, {B, D}, and {B, E}, never occur together in any clustering result. Thus, the value of b is four. The Rand index (RI) is then 0.6.
Adjusted Rand Index (ARI)
RI suffers from one drawback; it yields a high value for pairs of random partitions of a given set of examples. To understand this drawback, think about randomly grouping a number of examples. When the number of partitions in each grouping, that is when the number of clusters, is increased, more and more example pairs are going to be in agreement because they are more likely to be not grouped together. This will result in a high RI value. Thus, RI is not able to take into consideration effects of random groupings. To counter this drawback, an adjustment is made to the calculations by taking into consideration grouping by chance. This is done by using a specialized distribution, the generalized hyper-geometric distribution, for modeling the randomness. The resulting measure is known as the adjusted Rand index (ARI).
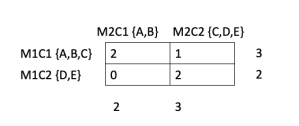 ARI is best understood using an example. So let's look at the example of two clustering results used earlier. Let's create a contingency table summarizing the results of two clustering methods. In this case, it is a 2x2 table wherein each cell of the table shows the number of times an example occurs in two clusters referenced by the corresponding row and column. M1C1 and M1C2 refer to two clusters formed by a hypothetical method-1. M2C1 and M2C2 similarly refer to two clusters formed by method-2. For clarity sake, I have included the examples forming the respective clusters next to M1C1, M1C2 etc. The top left cell has an entry of 2 because the clusters M1C1 and M2C1 share two examples, A and B. Entries in the other cells have similar meaning. The numbers to the right and below the contingency table show the sums along respective rows and columns.
To write the formula for ARI, lets generalize the entries of the contingency table using the following notation:
$n_{ij} = \text{Number of examples common to cluster i and cluster j}$
$a_i = \text{Sum of contingency cells in row i}$
$b_j = \text{Sum of contingency cells in column j}$
The ARI is then expressed as:

The first term in the numerator is known as index, and the second term as expected index. The first term in the denominator is called maximum index, and the second term of the denominator is same as the second term of the numerator. With these designations of the terms, the ARI is often expressed as
$\text{ARI} = \frac{\text{index - expected index}}{\text{maximum index - expected index}}$
Now lets go back to the contingency table for our example and calculate the different parts of the ARI formula first. We have:
$\sum_{ij}\binom{n_{ij}}{2} = \binom{2}{2} + \binom{1}{2} + \binom{0}{2} + \binom{2}{2} = (1 + 0 + 0 + 1)=2$
$\sum_i\binom{a_i}{2} = (\binom{3}{2}+\binom{2}{2}) = (3 + 1)=4$
$latex \sum_j\binom{b_j}{2} = (\binom{2}{2}+\binom{3}{2}) = (1 + 3) = 4$
Thus the index value for our example is 2; the expected index value is 1.6 (4*4/(5*4/2)). The maximum index value is 4. Therefore, the ARI for our example is (2 - 1.6)/(4 - 1.6), which equals 0.1666. We see that RI is much higher than ARI; this is typical of these indices. While RI always lies in 0-1; ARI can achieve a negative value also.
ARI is not the only measure to compare two sets of groupings. Mutual information based measure, adjusted mutual information (AMI), is also used for this purpose. May be in one of the future posts, I will describe this measure.