Words as Vectors

[This post was originally published on April 13, 2015.]

Vector space model is well known in information retrieval where each document is represented as a vector. The vector components represent weights or importance of each word in the document. The similarity between two documents is computed using the cosine similarity measure.

Although the idea of using vector representation for words also has been around for some time, the interest in word embedding, techniques that map words to vectors, has been soaring recently. One driver for this has been Tomáš Mikolov's Word2vec algorithm which uses a large amount of text to create high-dimensional (50 to 300 dimensional) representations of words capturing relationships between words unaided by external annotations. Such representation seems to capture many linguistic regularities. For example, it yields a vector approximating the representation for vec('Rome') as a result of the vector operation vec('Paris') - vec('France') + vec('Italy').

Word2vec uses a single hidden layer, fully connected neural network as shown below. The neurons in the hidden layer are all linear neurons. The input layer is set to have as many neurons as there are words in the vocabulary for training. The hidden layer size is set to the dimensionality of the resulting word vectors. The size of the output layer is same as the input layer. Thus, assuming that the vocabulary for learning word vectors consists of V words and N to be the dimension of word vectors, the input to hidden layer connections can be represented by matrix WI of size VxN with each row representing a vocabulary word. In same way, the connections from hidden layer to output layer can be described by matrix WO of size NxV. In this case, each column of WO matrix represents a word from the given vocabulary. The input to the network is encoded using "1-out of -V" representation meaning that only one input line is set to one and rest of the input lines are set to zero.
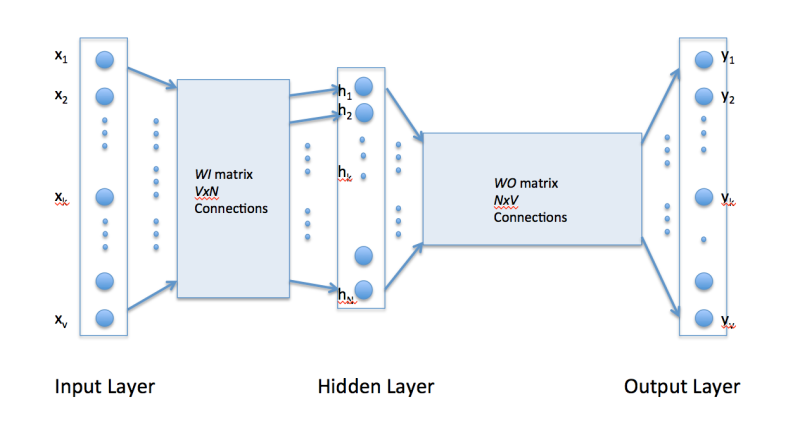


To get a better handle on how Word2vec works, consider the training corpus having the following sentences:


"the dog saw a cat", "the dog chased the cat", "the cat climbed a tree"

The corpus vocabulary has eight words. Once ordered alphabetically, each word can be referenced by its index. For this example, our neural network will have eight input neurons and eight output neurons. Let us assume that we decide to use three neurons in the hidden layer. This means that WI and WO will be 8x3 and 3x8 matrices, respectively. Before training begins, these matrices are initialized to small random values as is usual in neural network training. Just for the illustration sake, let us assume WI and WO to be initialized to the following values:


WI =

W0 =


Suppose we want the network to learn relationship between the words "cat" and "climbed". That is, the network should show a high probability for "climbed" when "cat" is inputted to the network. In word embedding terminology, the word "cat" is referred as the context word and the word "climbed" is referred as the target word. In this case, the input vector X will be [0 1 0 0 0 0 0 0]t. Notice that only the second component of the vector is 1. This is because the input word is "cat" which is holding number two position in sorted list of corpus words. Given that the target word is "climbed", the target vector will look like [0 0 0 1 0 0 0 0 ]t.

With the input vector representing "cat", the output at the hidden layer neurons can be computed as

Ht = XtWI = [-0.490796 -0.229903 0.065460]

It should not surprise us that the vector H of hidden neuron outputs mimics the weights of the second row of WI matrix because of 1-out-of-V representation. So the function of the input to hidden layer connections is basically to copy the input word vector to hidden layer. Carrying out similar manipulations for hidden to output layer, the activation vector for output layer neurons can be written as

HtWO = [0.100934 -0.309331 -0.122361 -0.151399 0.143463 -0.051262 -0.079686 0.112928]

Since the goal is produce probabilities for words in the output layer, Pr(wordk|wordcontext) for k = 1, V, to reflect their next word relationship with the context word at input, we need the sum of neuron outputs in the output layer to add to one. Word2vec achieves this by converting activation values of output layer neurons to probabilities using the softmax function. Thus, the output of the k-th neuron is computed by the following expression where activation(n) represents the activation value of the n-th output layer neuron:


Thus, the probabilities for eight words in the corpus are:


0.143073 0.094925 0.114441 0.111166 0.149289 0.122874 0.119431 0.144800

The probability in bold is for the chosen target word "climbed". Given the target vector [0 0 0 1 0 0 0 0 ]t, the error vector for the output layer is easily computed by subtracting the probability vector from the target vector. Once the error is known, the weights in the matrices WO and WI


The probability in bold is for the chosen target word "climbed". Given the target vector [0 0 0 1 0 0 0 0 ]t, the error vector for the output layer is easily computed by subtracting the probability vector from the target vector. Once the error is known, the weights in the matrices WO and WI

can be updated using backpropagation. Thus, the training can proceed by presenting different context-target words pair from the corpus. In essence, this is how Word2vec learns relationships between words and in the process develops vector representations for words in the corpus.

Continuous Bag of Words (CBOW) Learning

The above description and architecture is meant for learning relationships between pair of words. In the continuous bag of words model, context is represented by multiple words for a given target words. For example, we could use "cat" and "tree" as context words for "climbed" as the target word. This calls for a modification to the neural network architecture. The modification, shown below, consists of replicating the input to hidden layer connections C times, the number of context words, and adding a divide by C operation in the hidden layer neurons. [An alert reader pointed that the figure below might lead some readers to think that CBOW learning uses several input matrices. It is not so. It is the same matrix, WI, that is receiving multiple input vectors representing different context words]
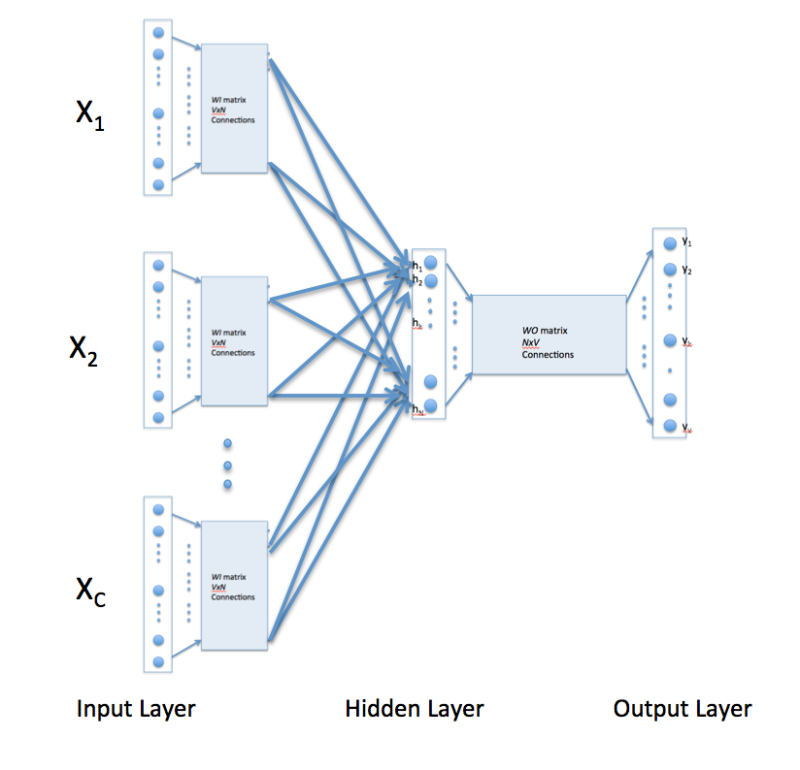


With the above configuration to specify C context words, each word being coded using 1-out-of-V representation means that the hidden layer output is the average of word vectors corresponding to context words at input. The output layer remains the same and the training is done in the manner discussed above.

Skip-Gram Model

Skip-gram model reverses the use of target and context words. In this case, the target word is fed at the input, the hidden layer remains the same, and the output layer of the neural network is replicated multiple times to accommodate the chosen number of context words. Taking the example of "cat" and "tree" as context words and "climbed" as the target word, the input vector in the skim-gram model would be [0 0 0 1 0 0 0 0 ]t, while the two output layers would have [0 1 0 0 0 0 0 0] t and [0 0 0 0 0 0 0 1 ]t as target vectors respectively. In place of producing one vector of probabilities, two such vectors would be produced for the current example. The error vector for each output layer is produced in the manner as discussed above. However, the error vectors from all output layers are summed up to adjust the weights via backpropagation. This ensures that weight matrix WO for each output layer remains identical all through training.


In above, I have tried to present a simplistic view of Word2vec. In practice, there are many other details that are important to achieve training in a reasonable amount of time. At this point, one may ask the following questions:

1. Are there other methods for generating vector representations of words? The answer is yes and I will be describing another method in my next post.

2. What are some of the uses/advantages of words as vectors. Again, I plan to answer it soon in my coming posts.


Graph Embedding with GraphSAGE

Graph embedding refers to learning low-dimensional representations of nodes in a network; the representation encodes structural information and node features. Such a representation can then be used for various downstream machine learning tasks like node classification, link prediction, visualization, etc. The downstream tasks often work with dynamic or evolving networks such as social networks, recommendation networks etc. The majority of the graph embedding methods assume fixed graph structure and thus are unsuitable for dynamic networks. The GraphSAGE embedding method overcomes this limitation by incorporating two changes, sampling and aggregating features, in the graph convolutional networks (GCNs) that are used for fixed structure networks. These changes, explained below, make GraphSAGE not only computationally efficient to scale to very large graphs but also permit embeddings to be generated for those nodes of a graph not seen before. This inductive capability to work with unseen data makes GraphSAGE a highly valuable node embedding tool suitable for a large number of applications. In this blog post, I will highlight the aggregation and sampling used in GraphSAGE and provide an example of its usage. Before reading on, you may want to go over my post on graph convolutional networks

How Does GraphSAGE Perform Aggregation?

We will assume each node has a feature vector associated with it. The associated feature vector with a node, for example, may be the profile of the person represented by the node. In absence of explicit features, structural features of nodes such as the node degree are used in GraphSAGE. 

The key component of GraphSAGE algorithm is that embedding of a node is obtained by aggregating embeddings in a layer-wise manner by slowly expanding the local neighborhood of the node. At layer-0, the embedding of a node is simply its feature vector. Thus, the embedding of the target node A at layer-0 in the graph shown below is $\bf X_A$.

Figure 1. Input Graph for Embedding

The layer-1 embedding of a node is the aggregate embedding of all of its neighboring nodes away at one link. Similarly, the layer-2 embedding of a node is obtained by aggregating embeddings of its 2-neighborhood nodes. Figure 2 below shows this layer-wise embedding process for the target node A of the input graph of Figure 1.


Figure 2. Layer-wise Embedding of Target Node A

The actual aggregation is done by learning aggregation functions for different layers. The square boxes in Figure 2 denote these functions. The configuration of Figure 2 defines a graph convolutional neural network where the hidden layer outputs can be expressed as follows for layers 1-K.

For k = 2, we get the embedding vector $\bold{Z}_A for the target node in the above graph. The matrices W and B are the trainable matrices. These trainable matrices are learned by defining a suitable loss function. Both supervised and unsupervised learnings are possible.

While the above description for aggregation appears similar to that used in graph convolutional networks, the difference is that the aggregation function is learned during training in GraphSAGE and it is predefined and fixed in GCNs. It is this difference that makes GraphSAGE an inductive learner as opposed to GCNs being transductive learners.

Neighborhood Sampling in GraphSAGE

In graph convolution networks, every neighboring node of the target node at the specified neighborhood size participates in message passing and contributes towards the computation of the embedded vector of the target node. When the neighborhood size is enlarged, the number of nodes contributing to the embedded vector computation can grow exponentially for certain graphs. This problem gets exacerbated  when the neighborhood of a target node includes a hub or celebrity node having millions of connections. To avoid exponential computation growth, GraphSAGE algorithm randomly selects only a sample of neighboring nodes. This allows GraphSAGE to be used for extremely large graphs with billions of nodes. You can see an illustration of neighborhood sampling in Figure 3 below where the No icon shows the nodes not being sampled.

Figure 3. Illustration of Neighborhood Sampling

Now, let's use GraphSage to generate node embeddings for link prediction.

Applying GraphSAGE to Perform Link Prediction

In link prediction, the objective is to predict whether a link exists between a pair of nodes. Link prediction has many applications; for example, it is used for recommending friends on social media networks. 

We will use the Cora dataset, widely used in graph machine learning similar to the usage of MNIST dataset in deep learning.  The Cora dataset consists of 2708 scientific publications classified into one of seven classes. Each publication is a node in the network, and is described by a 0/1-valued word vector of 1433 dimensions. The binary vector values represent the absence/presence of the corresponding word from the dictionary of 1433 unique words. The citation network has 10566 edges.

The implementation will be done using the  Deep Graph Learning (DGL) library, built for easy implementation of graph neural network models on top of existing deep learning frameworks such as PyTorch, MXNet and TensorFlow. Each node of a network is represented by a unique integer, called its node ID, in DGL. An edge is represented by a pair of integers corresponding to the IDs of its end nodes. You will need to install DGL before proceeding any further.

We begin by importing all necessary libraries. We also specify PyTorch as the backend for DGL.

       
import itertools
import os
os.environ["DGLBACKEND"] = "pytorch"
import dgl
import dgl.data
import numpy as np
import scipy.sparse as sp
import torch
import torch.nn as nn
import torch.nn.functional as F
%matplotlib inline

We are going to treat the link prediction problem as a binary classification problem. When a pair of nodes is connected, there is an edge linking them. We treat this as an example of positive class; the absence of a link between a node pair is treated as negative class example. A sample of positive and negative class examples will be extracted from Cora dataset with the rest of the data being treated as test data. We begin by loading the data. We pick 10% of the edges as positive class examples and the same number of edges as negative examples.

       
dataset = dgl.data.CoraGraphDataset()
g = dataset[0]
# Split edge set for training and testing
u, v = g.edges()

eids = np.arange(g.num_edges())
eids = np.random.permutation(eids)
test_size = int(len(eids) * 0.1)
train_size = g.num_edges() - test_size
test_pos_u, test_pos_v = u[eids[:test_size]], v[eids[:test_size]]
train_pos_u, train_pos_v = u[eids[test_size:]], v[eids[test_size:]]

# Find all negative edges and split them for training and testing
adj = sp.coo_matrix((np.ones(len(u)), (u.numpy(), v.numpy())))
adj_neg = 1 - adj.todense() - np.eye(g.num_nodes())
neg_u, neg_v = np.where(adj_neg != 0)

neg_eids = np.random.choice(len(neg_u), g.num_edges())
test_neg_u, test_neg_v = (
neg_u[neg_eids[:test_size]],
neg_v[neg_eids[:test_size]],
)
train_neg_u, train_neg_v = (
neg_u[neg_eids[test_size:]],
neg_v[neg_eids[test_size:]],
)
Next, we define our GraphSAGE model. We will use two convolution layers.

# build a two-layer GraphSAGE model
class GraphSAGE(nn.Module):
def __init__(self, in_feats, h_feats):
super(GraphSAGE, self).__init__()
self.conv1 = SAGEConv(in_feats, h_feats, "mean")
self.conv2 = SAGEConv(h_feats, h_feats, "mean")

def forward(self, g, in_feat):
h = self.conv1(g, in_feat)
h = F.relu(h)
h = self.conv2(g, h)
return h

Before training, we need to convert our original graph to a subgraph without test nodes. 

# Create a subgraph removing test nodes
train_g = dgl.remove_edges(g, eids[:test_size])

Now, the question is how do we perform link prediction using the embeddings that will be generated by our GraphSAGE model. Remember that link prediction operates on node pairs. Since we can describe a pair of nodes with an edge connecting them, we can set up our training and test data based on edges. To do so, we create four graphs: positive train graph, positive test graph, negative train graph, and negative test graph. All these graphs have same number of nodes as in the original data; however, the edges in each graph correspond to node pairs of positive and negative training and test examples. In DGL, we can do this by the following code.

# Create positive and negative train and test graphs
train_pos_g = dgl.graph((train_pos_u, train_pos_v), num_nodes=g.num_nodes())
train_neg_g = dgl.graph((train_neg_u, train_neg_v), num_nodes=g.num_nodes())

test_pos_g = dgl.graph((test_pos_u, test_pos_v), num_nodes=g.num_nodes())
test_neg_g = dgl.graph((test_neg_u, test_neg_v), num_nodes=g.num_nodes())

One way to predict the likelihood of a link between a pair of nodes is to compute the similarity of the respective node vectors. We will use the dot product to compute node similarities. The corresponding DGL code for this is as follows.

import dgl.function as fn

class DotPredictor(nn.Module):
def forward(self, g, h):
with g.local_scope():
g.ndata["h"] = h
# Compute a new edge feature named 'score' by a dot-product between the
# source node feature 'h' and destination node feature 'h'.
g.apply_edges(fn.u_dot_v("h", "h", "score"))
# u_dot_v returns a 1-element vector for each edge so you need to squeeze it.
return g.edata["score"][:, 0]

We are now ready to perform training. For training, we need to specify a loss function. We will use the binary cross-entropy loss. The performance evaluation metric is chosen as AUC (area under the curve). The following code snippets take care of the loss function and AUC.

model = GraphSAGE(train_g.ndata["feat"].shape[1], 16)
pred = DotPredictor()


def compute_loss(pos_score, neg_score):
scores = torch.cat([pos_score, neg_score])
labels = torch.cat(
[torch.ones(pos_score.shape[0]), torch.zeros(neg_score.shape[0])]
)
return F.binary_cross_entropy_with_logits(scores, labels)


def compute_auc(pos_score, neg_score):
scores = torch.cat([pos_score, neg_score]).numpy()
labels = torch.cat(
[torch.ones(pos_score.shape[0]), torch.zeros(neg_score.shape[0])]
).numpy()
return roc_auc_score(labels,scores)

We can now set up the training loop and begin training.

# We will use Adam optimizer
optimizer = torch.optim.Adam(
itertools.chain(model.parameters(), pred.parameters()), lr=0.01)

# training loop
all_logits = []
for e in range(100):
# forward
h = model(train_g, train_g.ndata["feat"])
pos_score = pred(train_pos_g, h)
neg_score = pred(train_neg_g, h)
loss = compute_loss(pos_score, neg_score)

# backward
optimizer.zero_grad()
loss.backward()
optimizer.step()

if e % 5 == 0:
print("In epoch {}, loss: {}".format(e, loss))

# Compute AUC
from sklearn.metrics import roc_auc_score

with torch.no_grad():
pos_score = pred(test_pos_g, h)
neg_score = pred(test_neg_g, h)
print("AUC", compute_auc(pos_score, neg_score))


The result of training is shown below.
In epoch 0, loss: 0.7079574465751648
In epoch 5, loss: 0.6902216076850891
In epoch 10, loss: 0.6735929250717163
In epoch 15, loss: 0.6262624263763428
In epoch 20, loss: 0.5796554684638977
In epoch 25, loss: 0.555548369884491
In epoch 30, loss: 0.5190547108650208
In epoch 35, loss: 0.5012964606285095
In epoch 40, loss: 0.48360729217529297
In epoch 45, loss: 0.46244215965270996
In epoch 50, loss: 0.4450105130672455
In epoch 55, loss: 0.4255025088787079
In epoch 60, loss: 0.41155683994293213
In epoch 65, loss: 0.396867573261261
In epoch 70, loss: 0.3816315531730652
In epoch 75, loss: 0.36709561944007874
In epoch 80, loss: 0.3521302044391632
In epoch 85, loss: 0.33679577708244324
In epoch 90, loss: 0.32077470421791077
In epoch 95, loss: 0.3040713667869568
AUC 0.8397133936793872
The AUC value of 0.839 indicates that the model is performing well.

That's all for GraphSAGE. Let me know how you liked it.


CCA for Finding Latent Relationships and Dimensionality Reduction

Canonical Correlation Analysis (CCA) is a powerful statistical technique. In machine learning and multimedia information retrieval, CCA plays a vital role in uncovering intricate relationships between different sets of variables. In this blog post, we will look into this powerful technique and show how it can be used for finding hidden correlations as well as for dimensionality reduction.

To understand CCA's capabilities, let’s take a look at two sets of observations, X and Y, shown below. These two sets of observations are made on the same set of objects and each observation represents a different variable.

Two Sets of Observations


When computing the pairwise correlation between the column vectors of X and Y, we obtain the following set of values, where the entry at (i,j) represents the correlation between the i-th column of X and the j-th column of Y.

The resulting correlation values give us some insight between the two sets of measurements. The correlation values show moderate to almost no correlation between the columns of the two datasets except a relatively higher correlation between the second column of X and the third column of Y.

Hidden Relationship

It looks like there is not much of a relationship between X and Y. Is that so? Let's wait before concluding that X and Y do not have much of a relationship.

Lets transform X and Y into one-dimensional arrays, a and b, using the vectors [-0.427 -0.576 0.696] and [0 0 -1].

a = X[-0.427 -0.576 0.696]T

b = Y[0 0 -1]T

Now, let's calculate the correlation between a and b. Wow! we get a correlation value of 0.999, meaning that the two projections of X and Y are very strongly correlated. In other words, there is a very strong hidden relationship present in our two sets of observations. Wow! How did we end up getting a and b?” The answer to this is the canonical correlation analysis. 

What is Canonical Correlation Analysis?

Canonical correlation analysis is a technique that looks for pairs of basis vectors for two sets of variables X and Y such that the correlation between the projections of X and Y  onto these basis vectors are mutually maximized. In other words, the transformed arrays show much higher correlation to bring out any hidden relationship. The number of pairs of such basis vectors is limited to the smallest dimensionality of X and Y. For example, if X is an array of size nxp and Y of size nxq, then the number of basis vectors cannot exceed min{p,q}.

Assume wx and wy be the pair of basis vectors projecting X and Y into a and b given by a=Xwx, and b=Ywy. The projections a and b are called the scores or the canonical variates. The correlation between the projections, after some algebraic manipulation, can be expressed as:

$\Large \rho = \frac{\bf{w}_{x}^T \bf{C}_{xy}\bf{w}_{y}}{\sqrt{\bf{w}_{x}^T \bf{C}_{xx}\bf{w}_{x}\bf{w}_{y}^T \bf{C}_{yy}\bf{w}_{y}}}$,

where CxxCxy and Cyy  are three covariance matrices. The canonical correlations between X and Y are found by solving the eigenvalue equations

$ \bf{C}_{xx}^{-1}\bf{C}_{xy}\bf{C}_{yy}^{-1}\bf{C}_{yx}\bf{w}_x = \rho^2 \bf{w}_x$

$ \bf{C}_{yy}^{-1}\bf{C}_{yx}\bf{C}_{xx}^{-1}\bf{C}_{xy}\bf{w}_y = \rho^2 \bf{w}_y$

The eigenvalues in the above solution correspond to the squared canonical correlations and the corresponding eigenvectors yield the needed basis vectors. The number of non-zero solutions to these equations are limited to the smallest dimensionality of X and Y.

CCA Example

Let’s take a look at an example using the wine dataset from the sklearn library. We will divide the13 features of the dataset into X and Y sets of observations. The class labels in our example will act as hidden or latent feature. First, we will load the data, split it into X and Y and perform feature normalization.

from sklearn.datasets import load_wine
import numpy as np
wine = load_wine()
X = wine.data[:, :6]# Form X using first six features
Y = wine.data[:, 6:]# Form Y using the remaining seven features
# Perform feature normalization
from sklearn.preprocessing import StandardScaler
scaler = StandardScaler()
X = scaler.fit_transform(X)
Y = scaler.fit_transform(Y)

Next, we import CCA object and fit the data. After that we obtain the canonical variates. In the code below, we are calculating 3 projections, X_c and Y_c, each for X and Y.

from sklearn.cross_decomposition import CCA
cca = CCA(n_components=3)
cca.fit(X, Y)
X_c, Y_c = cca.transform(X, Y)
We can now calculate the canonical correlation coefficients to see what correlation values are obtained.
cca_corr = np.corrcoef(X_c.T, Y_c.T).diagonal(offset=3)
print(cca_corr)

[0.90293514 0.73015495 0.51667522]

The highest canonical correlation value is 0.9029, indicating a strong hidden relationship between the two sets of vectors. Let us now try to visualize whether these correlations have captured any hidden relationship or not. In the present example, the underlying latent information not available to CCA is the class-membership of different measurements in X and Y. To check this, I have plotted the scatter plots of the three sets of x-y canonical variates where each variate pair is colored using the class label not accessible to CCA. These plots are shown below. It is clear that the canonical variates associated with the highest correlation coefficient show the existence of three groups in the scatter plot. This means that CCA is able to discern the presence of a hidden variable that reflects the class membership of the different observations.


Summary

Canonical Correlation Analysis (CCA) is a valuable statistical technique that enables us to uncover hidden relationships between two sets of variables. By identifying the most significant patterns and correlations, CCA helps gain valuable insights with numerous potential applications. CCA can be also used for dimensionality reduction. In machine and deep learning, CCA has been used for cross-modal learning and cross-modal retrieval.